Internal Monitoring
The Internal Monitoring tab displays the VM performance data, such
as the CPU, memory, and disk capacity, obtained by the agent from a host. These data is
displayed dynamically in real time through graphs. Note: Before you can view the internal
monitoring data, install an agent for the VM instance. For details about how to
install the agent, see Internal Monitoring Agent.
Note: Before you can view the internal
monitoring data, install an agent for the VM instance. For details about how to
install the agent, see Internal Monitoring Agent.
Note: Before you can view the internal
monitoring data, install an agent for the VM instance. For details about how to
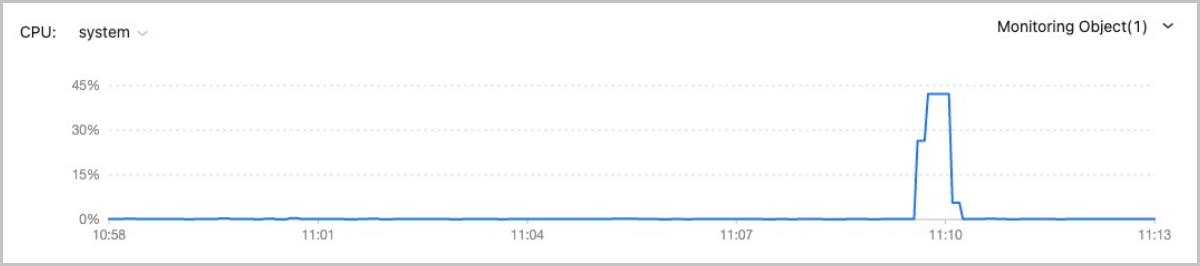
install the agent, see Internal Monitoring Agent.CPU
You can select a time span to view the real-time CPU utilization of a VM instance.
- Available time spans: 15 minutes, 1 hour, 6 hours, 1 day, 1 week, 1 month, 1 year, and custom.
- Monitoring metrics:
- system: The percentage of CPUs occupied by the current kernel space of the VM instance.
- user: The percentage of CPUs occupied by the current user process of the VM instance.
- wait: The percentage of CPUs used for waiting for the I/O operations of the VM instance.
- idle: The percentage of idle CPUs of the VM instance.
- used: The percentage of used CPUs of the VM instance.
- Monitoring object:
- Select All: Display the average, real-time utilization of all CPUs of a VM instance and the utilization of a single CPU.
- Average: Display the average, real-time utilization of all CPUs of a VM instance.
- Single CPU: Display the real-time utilization of a single CPU, such as CPU No. 1, No.2, and No. 3.
Memory
You can select a time span to view the real-time memory utilization of a VM
instance.
- Available time spans: 15 minutes, 1 hour, 6 hours, 1 day, 1 week, 1 month, 1 year, and custom.
- Monitoring metrics:
- used: The used memory of a VM instance.
- available: The available memory of a VM instance.
- free: The idle memory of a VM instance.
- total: The total memory of a VM instance.
- freeutilization: The percentage of idle memory of a VM instance.
- usedutilization: The percentage of the used memory of a VM instance.
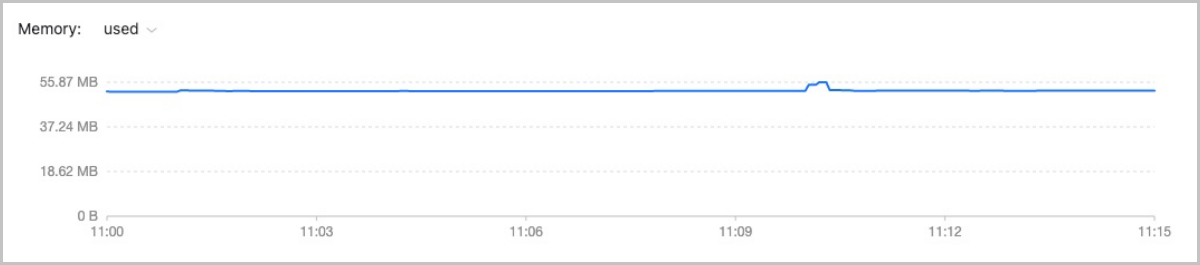 Note: For memory data, internal monitoring is more accurate than external monitoring. We
recommend that you use internal monitoring to monitor the memory data.
Note: For memory data, internal monitoring is more accurate than external monitoring. We
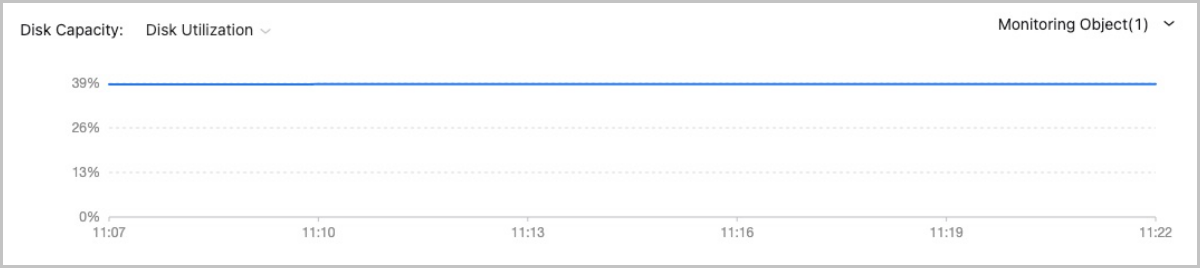
recommend that you use internal monitoring to monitor the memory data.Disk Capacity
You can select a time span to view the real-time disk capacity of a VM instance.
- Available time spans: 15 minutes, 1 hour, 6 hours, 1 day, 1 week, 1 month, 1 year, and custom.
- Monitoring metrics:
- Disk utilization: The percentage of used disk of a VM instance.
- Disk used capacity: The used capacity of the VM disk.
- Disk idle rate: The percentage of idle disk capacity of a VM instance.
- Disk idle capacity: The idle disk capacity of a VM instance.
- Monitoring object:
- Select All: Display the real-time status of all disk partitions.
- Single disk partition: Display the real-time read/write status of a single disk partition, such as the vda partition.